Potential zones of drought
Fruit shrubs
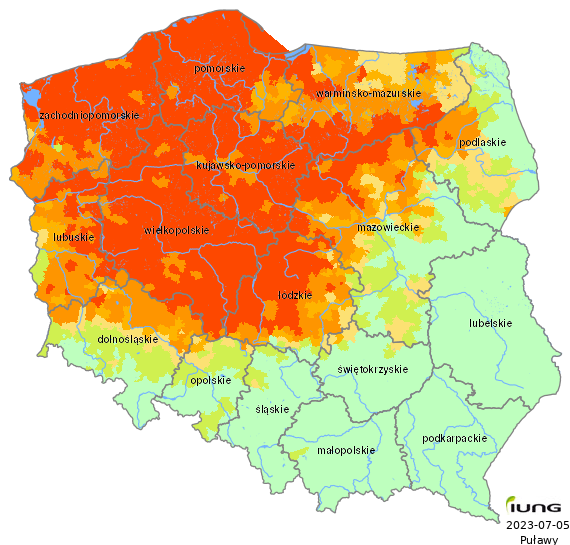
| Voivodeship (NUTS-2) | Total number of administrative districts | Number of the administrative districts under threat of drought | Percentage of administrative districts under threat of drought | Percentage of area under threat of drought |
|---|---|---|---|---|
| dolnośląskie | 169 | 116 | 68.64 | 23.47 |
| kujawsko-pomorskie | 144 | 144 | 100.00 | 92.84 |
| lubelskie | 213 | 1 | 0.47 | 0.08 |
| lubuskie | 82 | 82 | 100.00 | 68.14 |
| łódzkie | 177 | 173 | 97.74 | 69.34 |
| małopolskie | 182 | 2 | 1.10 | 0.01 |
| mazowieckie | 314 | 221 | 70.38 | 33.88 |
| opolskie | 71 | 35 | 49.30 | 4.60 |
| podkarpackie | 160 | 0 | 0.00 | 0.00 |
| podlaskie | 118 | 71 | 60.17 | 18.28 |
| pomorskie | 123 | 122 | 99.19 | 89.20 |
| śląskie | 167 | 10 | 5.99 | 0.39 |
| świętokrzyskie | 102 | 9 | 8.82 | 0.82 |
| warmińsko-mazurskie | 116 | 116 | 100.00 | 59.92 |
| wielkopolskie | 226 | 226 | 100.00 | 92.65 |
| zachodniopomorskie | 113 | 113 | 100.00 | 87.83 |
| Polska | 2477 | 1441 | 58.18 | 43.27 |
Participation of soils at drought risk
| The drought benchmark (according to the Act. Dz. U No. 150) was not exceeded | |
| < 10 % | |
| 10 - 30 % | |
| 30 - 50 % | |
| 50 - 80 % | |
| > 80 % |