Potential zones of drought
Winter cereals
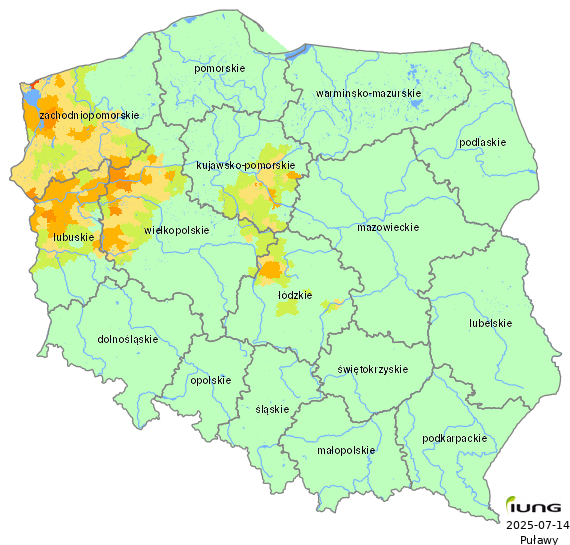
| Voivodeship (NUTS-2) | Total number of administrative districts | Number of the administrative districts under threat of drought | Percentage of administrative districts under threat of drought | Percentage of area under threat of drought |
|---|---|---|---|---|
| dolnośląskie | 169 | 0 | 0.00 | 0.00 |
| kujawsko-pomorskie | 144 | 57 | 39.58 | 3.50 |
| lubelskie | 213 | 0 | 0.00 | 0.00 |
| lubuskie | 82 | 42 | 51.22 | 12.78 |
| łódzkie | 177 | 23 | 12.99 | 2.07 |
| małopolskie | 183 | 0 | 0.00 | 0.00 |
| mazowieckie | 314 | 0 | 0.00 | 0.00 |
| opolskie | 71 | 0 | 0.00 | 0.00 |
| podkarpackie | 160 | 0 | 0.00 | 0.00 |
| podlaskie | 119 | 0 | 0.00 | 0.00 |
| pomorskie | 123 | 0 | 0.00 | 0.00 |
| śląskie | 167 | 0 | 0.00 | 0.00 |
| świętokrzyskie | 102 | 0 | 0.00 | 0.00 |
| warmińsko-mazurskie | 116 | 0 | 0.00 | 0.00 |
| wielkopolskie | 226 | 63 | 27.88 | 4.80 |
| zachodniopomorskie | 113 | 75 | 66.37 | 10.96 |
| Polska | 2479 | 260 | 10.49 | 1.89 |
Participation of soils at drought risk
| The drought benchmark (according to the Act. Dz. U No. 150) was not exceeded | |
| < 10 % | |
| 10 - 30 % | |
| 30 - 50 % | |
| 50 - 80 % | |
| > 80 % |