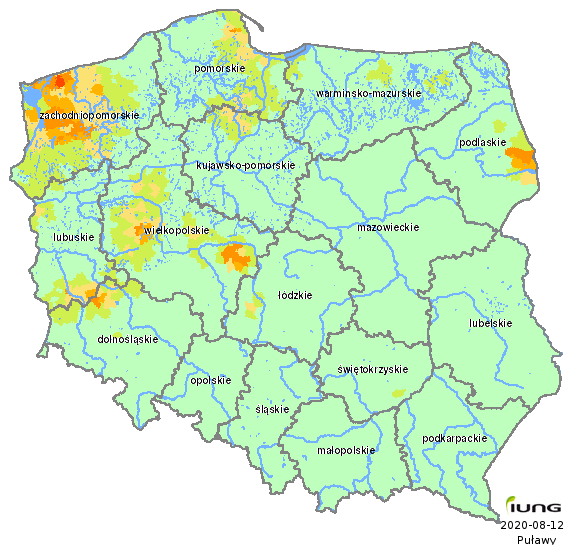
Potential zones of drought
Leguminous crops
| Voivodeship (NUTS-2) | Total number of administrative districts | Number of the administrative districts under threat of drought | Percentage of administrative districts under threat of drought | Percentage of area under threat of drought |
|---|---|---|---|---|
| dolnośląskie | 169 | 18 | 10.65 | 1.00 |
| kujawsko-pomorskie | 144 | 11 | 7.64 | 0.29 |
| lubelskie | 213 | 0 | 0.00 | 0.00 |
| lubuskie | 82 | 19 | 23.17 | 2.79 |
| łódzkie | 177 | 4 | 2.26 | 0.12 |
| małopolskie | 182 | 0 | 0.00 | 0.00 |
| mazowieckie | 314 | 0 | 0.00 | 0.00 |
| opolskie | 71 | 0 | 0.00 | 0.00 |
| podkarpackie | 160 | 0 | 0.00 | 0.00 |
| podlaskie | 118 | 7 | 5.93 | 1.19 |
| pomorskie | 123 | 54 | 43.90 | 2.12 |
| śląskie | 167 | 0 | 0.00 | 0.00 |
| świętokrzyskie | 102 | 1 | 0.98 | 0.00 |
| warmińsko-mazurskie | 116 | 9 | 7.76 | 0.05 |
| wielkopolskie | 226 | 70 | 30.97 | 4.11 |
| zachodniopomorskie | 113 | 81 | 71.68 | 14.40 |
| Polska | 2477 | 274 | 11.06 | 1.61 |
Participation of soils at drought risk
| The drought benchmark (according to the Act. Dz. U No. 150) was not exceeded | |
| < 10 % | |
| 10 - 30 % | |
| 30 - 50 % | |
| 50 - 80 % | |
| > 80 % |