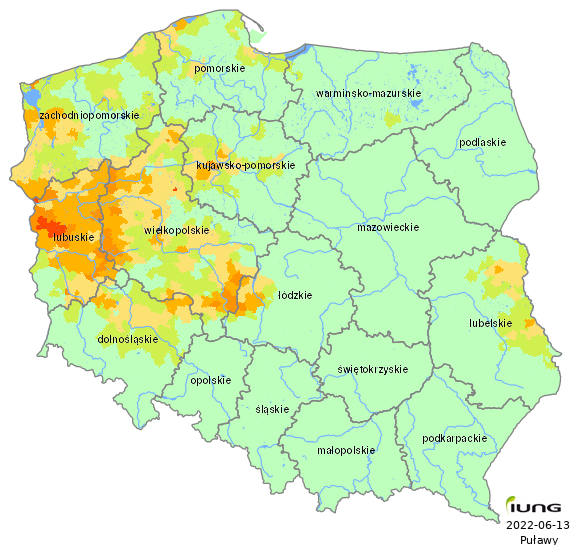
Potential zones of drought
Winter cereals
| Voivodeship (NUTS-2) | Total number of administrative districts | Number of the administrative districts under threat of drought | Percentage of administrative districts under threat of drought | Percentage of area under threat of drought |
|---|---|---|---|---|
| dolnośląskie | 169 | 57 | 33.73 | 4.31 |
| kujawsko-pomorskie | 144 | 37 | 25.69 | 2.71 |
| lubelskie | 213 | 43 | 20.19 | 1.90 |
| lubuskie | 82 | 67 | 81.71 | 31.73 |
| łódzkie | 177 | 16 | 9.04 | 3.02 |
| małopolskie | 182 | 0 | 0.00 | 0.00 |
| mazowieckie | 314 | 0 | 0.00 | 0.00 |
| opolskie | 71 | 0 | 0.00 | 0.00 |
| podkarpackie | 160 | 0 | 0.00 | 0.00 |
| podlaskie | 118 | 0 | 0.00 | 0.00 |
| pomorskie | 123 | 32 | 26.02 | 1.96 |
| śląskie | 167 | 0 | 0.00 | 0.00 |
| świętokrzyskie | 102 | 0 | 0.00 | 0.00 |
| warmińsko-mazurskie | 116 | 2 | 1.72 | 0.00 |
| wielkopolskie | 226 | 165 | 73.01 | 14.31 |
| zachodniopomorskie | 113 | 82 | 72.57 | 6.77 |
| Polska | 2477 | 501 | 20.23 | 3.81 |
Participation of soils at drought risk
| The drought benchmark (according to the Act. Dz. U No. 150) was not exceeded | |
| < 10 % | |
| 10 - 30 % | |
| 30 - 50 % | |
| 50 - 80 % | |
| > 80 % |