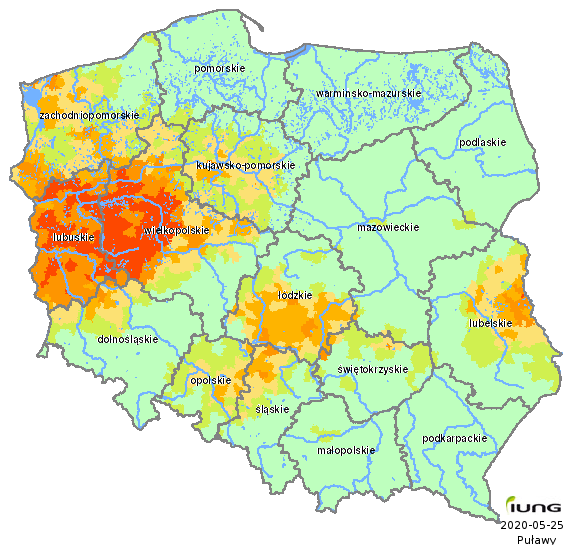
Potential zones of drought
Spring cereals
| Voivodeship (NUTS-2) | Total number of administrative districts | Number of the administrative districts under threat of drought | Percentage of administrative districts under threat of drought | Percentage of area under threat of drought |
|---|---|---|---|---|
| dolnośląskie | 169 | 43 | 25.44 | 3.99 |
| kujawsko-pomorskie | 144 | 95 | 65.97 | 7.88 |
| lubelskie | 213 | 97 | 45.54 | 7.29 |
| lubuskie | 82 | 82 | 100.00 | 72.73 |
| łódzkie | 177 | 104 | 58.76 | 15.64 |
| małopolskie | 182 | 2 | 1.10 | 0.01 |
| mazowieckie | 314 | 12 | 3.82 | 0.10 |
| opolskie | 71 | 55 | 77.46 | 6.94 |
| podkarpackie | 160 | 0 | 0.00 | 0.00 |
| podlaskie | 118 | 1 | 0.85 | 0.03 |
| pomorskie | 123 | 3 | 2.44 | 0.28 |
| śląskie | 167 | 52 | 31.14 | 7.46 |
| świętokrzyskie | 102 | 33 | 32.35 | 1.78 |
| warmińsko-mazurskie | 116 | 0 | 0.00 | 0.00 |
| wielkopolskie | 226 | 163 | 72.12 | 36.58 |
| zachodniopomorskie | 113 | 91 | 80.53 | 16.25 |
| Polska | 2477 | 833 | 33.63 | 10.14 |
Participation of soils at drought risk
| The drought benchmark (according to the Act. Dz. U No. 150) was not exceeded | |
| < 10 % | |
| 10 - 30 % | |
| 30 - 50 % | |
| 50 - 80 % | |
| > 80 % |