Potential zones of drought
Winter cereals
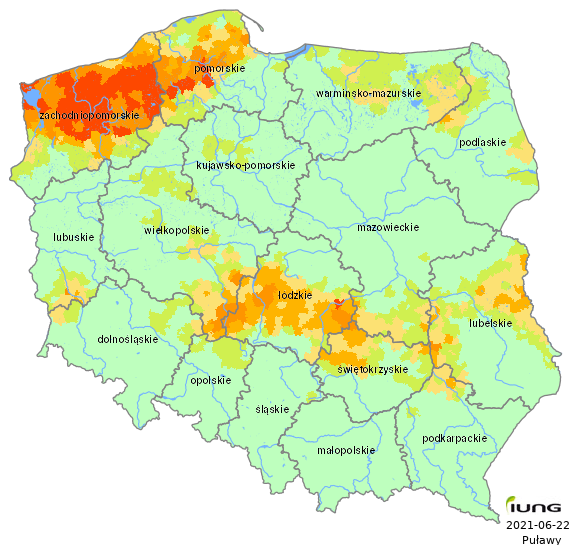
| Voivodeship (NUTS-2) | Total number of administrative districts | Number of the administrative districts under threat of drought | Percentage of administrative districts under threat of drought | Percentage of area under threat of drought |
|---|---|---|---|---|
| dolnośląskie | 169 | 11 | 6.51 | 0.46 |
| kujawsko-pomorskie | 144 | 11 | 7.64 | 0.11 |
| lubelskie | 213 | 86 | 40.38 | 5.50 |
| lubuskie | 82 | 13 | 15.85 | 1.77 |
| łódzkie | 177 | 103 | 58.19 | 19.93 |
| małopolskie | 182 | 0 | 0.00 | 0.00 |
| mazowieckie | 314 | 39 | 12.42 | 1.44 |
| opolskie | 71 | 8 | 11.27 | 0.25 |
| podkarpackie | 160 | 14 | 8.75 | 0.87 |
| podlaskie | 118 | 18 | 15.25 | 1.34 |
| pomorskie | 123 | 65 | 52.85 | 15.13 |
| śląskie | 167 | 1 | 0.60 | 0.06 |
| świętokrzyskie | 102 | 51 | 50.00 | 7.23 |
| warmińsko-mazurskie | 116 | 40 | 34.48 | 2.96 |
| wielkopolskie | 226 | 68 | 30.09 | 4.87 |
| zachodniopomorskie | 113 | 100 | 88.50 | 51.79 |
| Polska | 2477 | 628 | 25.35 | 7.02 |
Participation of soils at drought risk
| The drought benchmark (according to the Act. Dz. U No. 150) was not exceeded | |
| < 10 % | |
| 10 - 30 % | |
| 30 - 50 % | |
| 50 - 80 % | |
| > 80 % |